
Create Standards Overview Reports
Teachers and Administrators have a number of different ways to view standards performance information, but the first step is using the Standards Overview Table, which allows you to focus on performance for individual Strands and Standards across tests at the student, class, and school levels. Learning to use the Standards Overview Table and the reports related to it will help you quickly identify opportunities to help your students.
Use the Universal Selector to define what information you want to include in your Benchmark Reports. Check the Context Header to confirm what information is included in the report.
If you're looking for a particular section about creating Standards Overview Reports, use the links below to quickly move to that section:
Reading the Standards Performance Overview Report
Using the Standards Overview Table
Analyze Student Performance Over Time
Analyze Class Performance Over Time
Compare Student Performance Over Time
Student List with Standards Performance
Print or Download Standards Performance Data
You can begin by making a selection in the table on the left.

|
Why do overall average test scores sometimes differ for Standards Performance reports and Test Scores reports for the same assessment?
Standards Performance reports add up the points earned for each standard tagged to a question and in some cases a question may have multiple standards associated with it. Test Scores reports look only at the points earned for each question on the assessment. Because of this, an assessment can have a slightly different overall average test score based on whether you are looking at a Standards Performance-based vs a Test Scores-based report. |
Reading the Standards Performance Overview Report
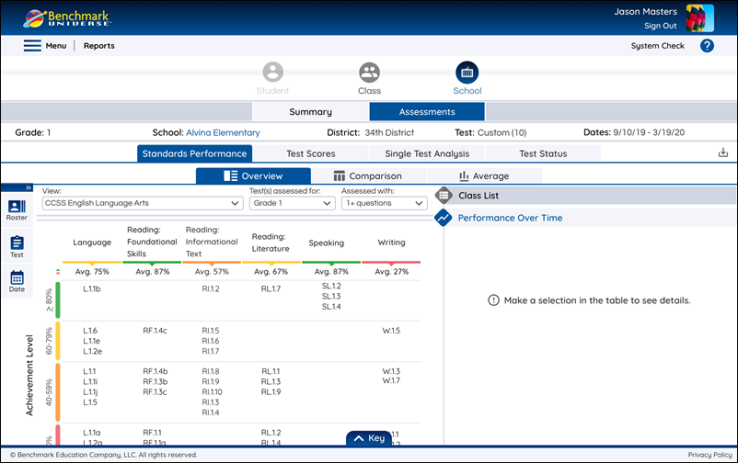
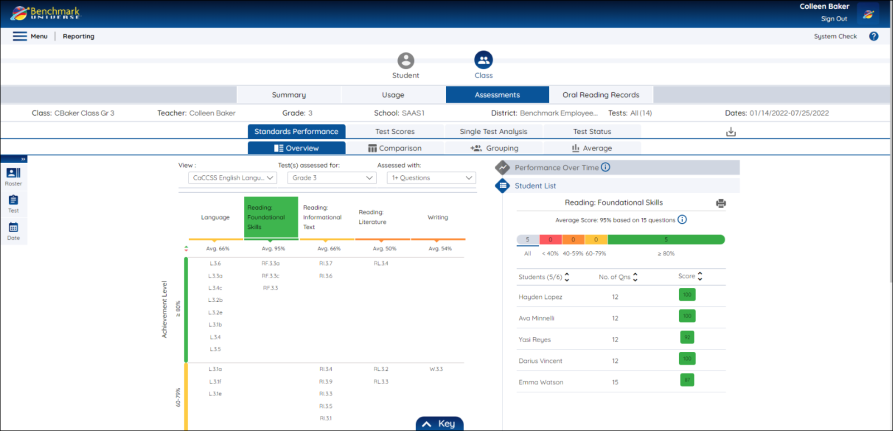
The Standards Performance Overview Report Table is an interactive chart that displays Standards performance information. Performance for certain standards and taxonomies can be selected in the View dropdown.
For example, you can choose to view performance for the state, Common Core standards, the grade level of your assessed tests, Claims & Targets, etc.
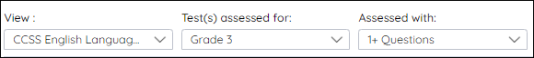
Use the “View” dropdown to select the set of standards or tags when viewing standards performance reports. For example, you can choose to view performance on state standards, Common Core standards, Depth of Knowledge, Claims & Targets, and more depending on the standards alignment to the tests.
Use the “Test(s) assessed for” dropdown to view results for assessments administered outside of your class grade level. For example, if you administered a second-grade test to your third-grade students, then the dropdown will appear to select either grade 2 or 3 results. This dropdown only appears when tests have been administered for a different grade.
Use the “Assessed with” dropdown to view standards performance based on the number of questions assessed. Select between 1 to 10 questions assessed for a strand, standard, or another tag such as Depth of Knowledge.
The color bands to the left side of the Standards Overview Table show the Achievement Level for each standard. Teachers and Administrators can quickly identify areas they want to analyze further.
- Green — 80% and above
- Yellow — 60-79%
- Orange — 40-59%
- Red — below 40%
At the same time, the columns in the Standards Overview Table give teachers an average score for performance at the Strand level.

|
Use the arrows to change the order of the Achievement Levels displayed for the Standards on the Standards Overview Table. |
Using the Standards Overview Table
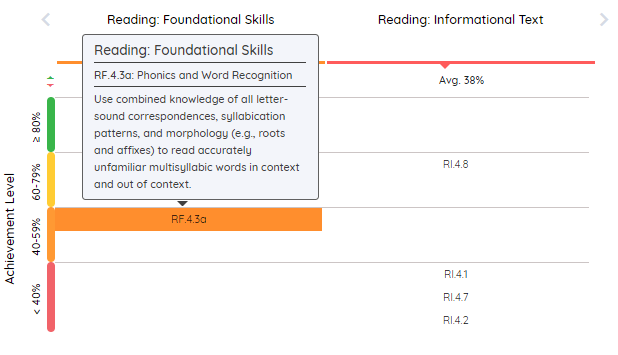
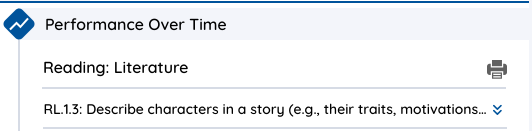
When you hover over a standard in the Standards Overview Table a tool tip appears showing the definition of the standard. When you click on a strand or standard you will see more detailed information about your selection to the right of the table. Depending on the context you’ve selected you will see Performance Over Time and/or a Student List.
You will only see strand and standards appear in the table if there is test data available based on the context you’ve selected.
|
|
If there is a green arrow to the left or right of the strands listed along the top of the Standards Overview Table it means you can click it to see additional strands and standards. |
Analyze Student Performance Over Time
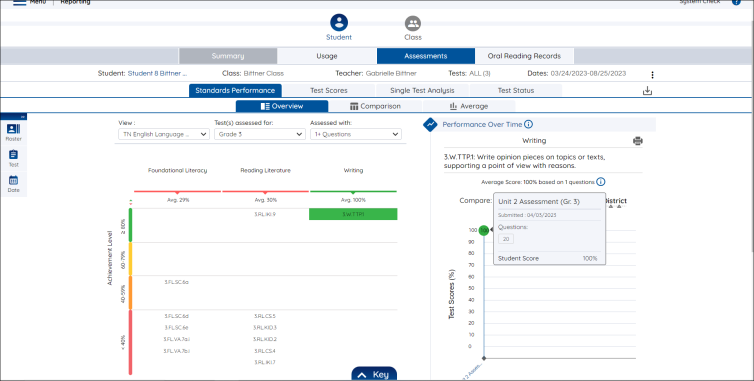
You can view an individual student’s Performance Over Time graph by making selections on the Standards Overview Table. This graph shows you how a student performed on each test that had questions related to the Strand or Standard you’ve selected from the Standard’s Overview Table.
- Use the Universal Selector to select a Student and a Test (or multiple tests).
- Click a strand or standard in the Standards Overview Table.
- View the Performance Over Time graph on the right.
_327x366.png)
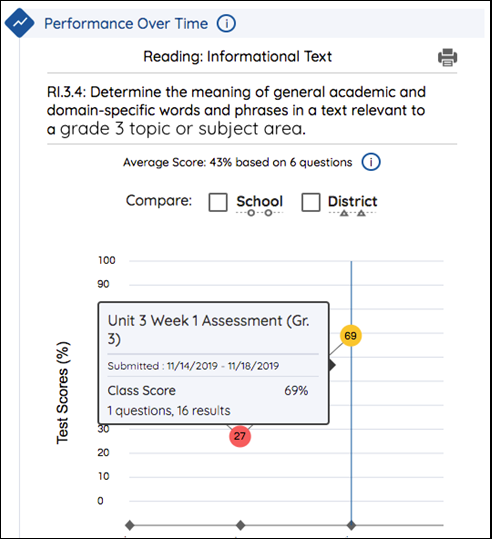
Clicking on a point in the graph displays the name of the assessment from which the assessment data was derived, when the assessment was submitted, and the student's average score displayed in a percentage.
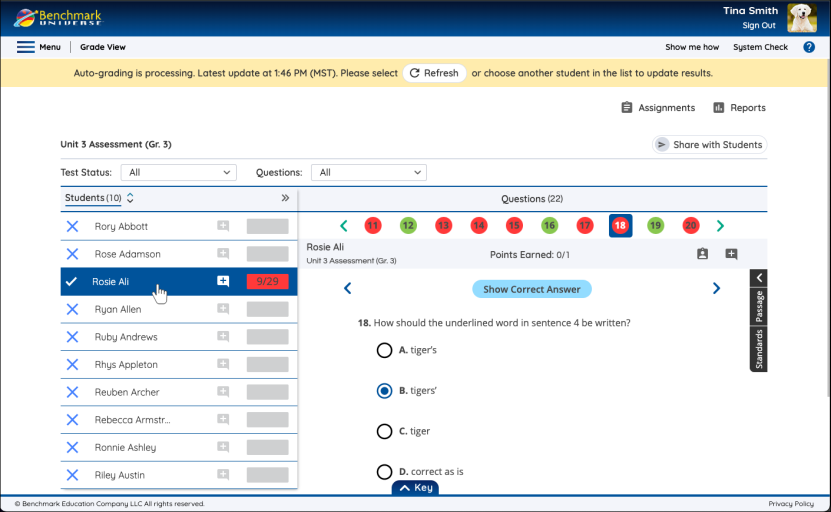
You can also click on a specific question in the popup window.
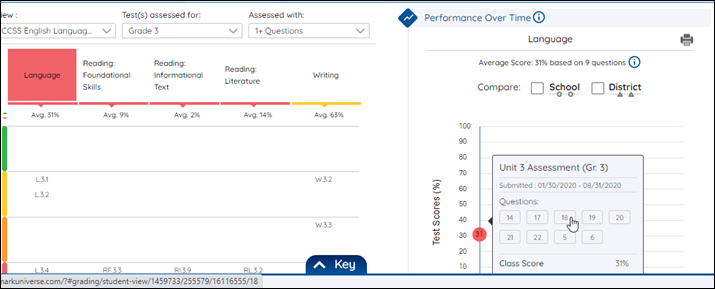
This takes you to the specific question in Grade View.
|
|
Teachers can create Standards Performance Over Time (SPOT) reports for single or multiple standards. These reports allow teachers to customize an individual student's standards performance data into a compact, printable report. See Create and Print SPOT Reports for more information. |
Analyze Class Performance Over Time
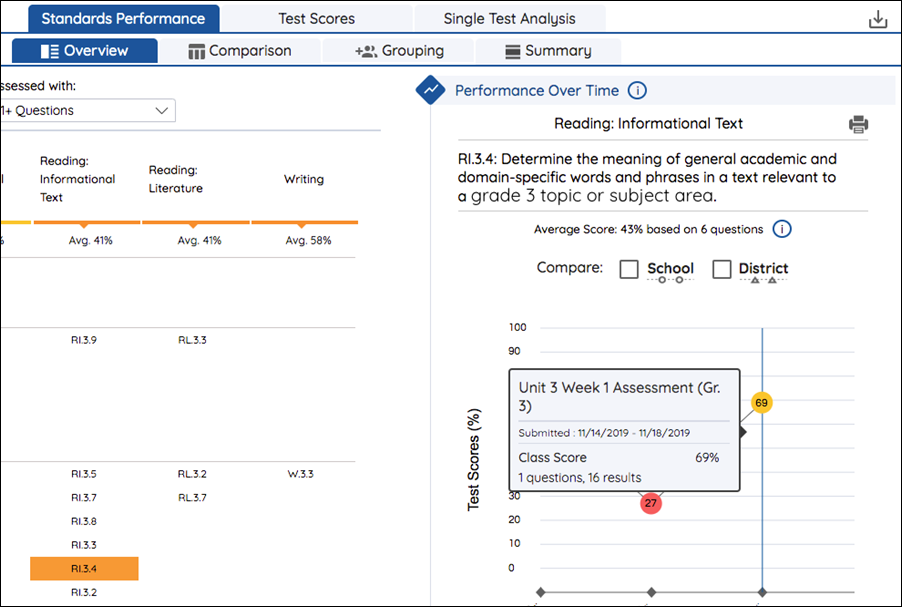
You can also view the Standards Performance Over Time of an entire class by making selections on the Standards Overview Table. This graph shows you how a class performed on each test that had questions related to the Strand or Standard you’ve selected from the Standard’s Overview Table.
- Use the Universal Selector to choose a Class and a Test (or multiple tests).
- Click a strand or standard in the Standards Overview Table.
- Click the Performance Over Time tab on the right-hand side to view the Performance Over Time graph.
Clicking on a point in the graph displays the name of the assessment from which the assessment data was derived, when the assessment was submitted, the class score, as well as the number of questions and results that were used to arrive at that percentage score.
|
|
You can easily move between different levels of reports by clicking on the Student and Class icons (Report Level Selector) along the top of the page. |
Compare Student Performance Over Time
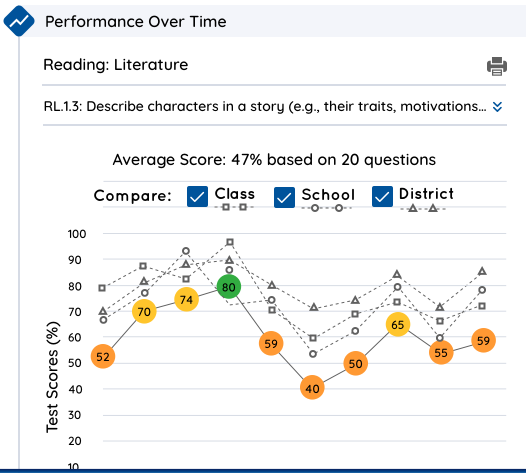
You can compare an individual student's performance to the average performance of their class, school, and district.
- Use the Universal Selector to select a Student and a Test (or multiple tests).
- Click a strand or standard in the Standards Overview Table.
- View the Performance Over Time graph on the right.
- Click on the Class, School, or District buttons to generate comparison graphs for your current report.
|
|
You can also compare the performance of a class to the average performance the school and district by using the Class tab in the Reports Level Selector and clicking on the comparison buttons above the generated graph. |
Student List with Standards Performance
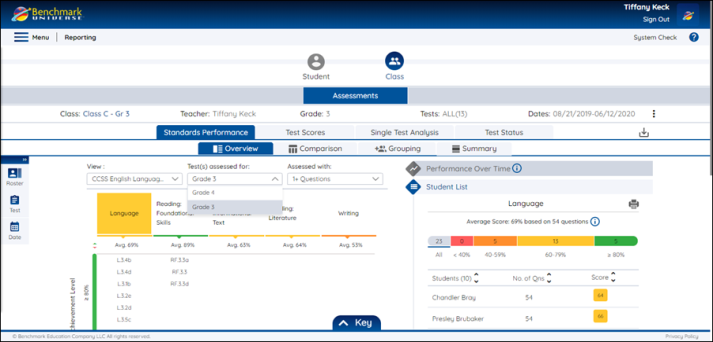
The Student List allows teachers to see a list of how each student in their class is performing on the strand or standard they selected from the Standards Overview Table. You can also use the bar above the list to filter by achievement level and use the arrows next to the column names to further sort the list. The Student List is only available when viewing class level data.
- Choose the Class icon from the Report Level Selector at the top of the page.
- Choose Standards Performance on the Report Type Selector tab.
- Use the Universal Selector to select a class from the Roster tab and click Apply.
- Select a test (or multiple tests) from the Test tab and click Apply.
- Click a strand or standard in the Standard Overview Table.
- View the Student List on the right-hand side.
- Click on the bar above the Student List to filter the list by achievement level.
|
|
Click on the name of a student in the Student List to see that student’s Performance Over Time graph. |
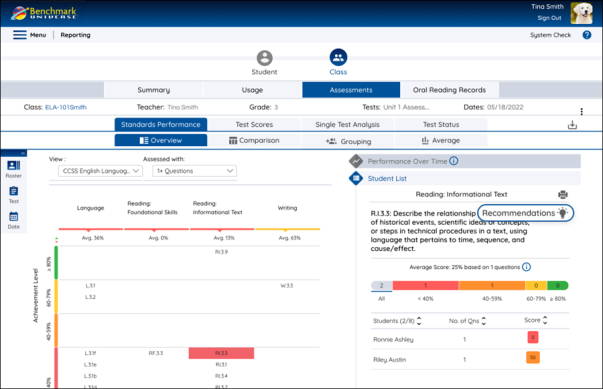
Instructional Recommendations
Teachers and administrators can access instructional recommendations to reteach and reassess standards. A light bulb appears when a standard is selected from the Standards Overview table.
|
|
Not all standards for grades 3-6 will have instructional recommendations. |
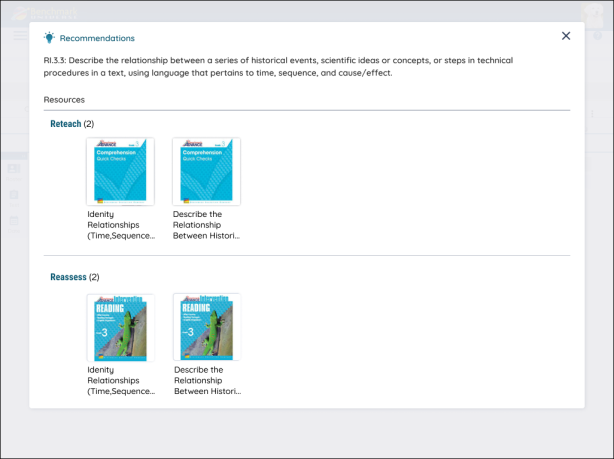
Selecting the light bulb opens a modal with teacher-facing resources to reteach and reassess the standard. Selecting a reteach or reassess resource will open in a new tab.
|
|
Instructional recommendations are available for Grades 3–6 in all editions of Benchmark Advance, beginning with ©2021, and Benchmark Adelante ©2022. |
Print or Download Standards Performance Data
Teachers can print their currently selected standards report data by using the Print icon on either the Student List or the Performance Over Time Graph.
Teachers can also use the csv. button to the right of the Report Detail Indicator to download a spreadsheet of the standards performance information for their entire class (in csv. format).
|
|
The standards performance information displayed in the .csv spreadsheet does not reflect your selections on the Standards Overview Table. The file contains the entire standards performance history of a class. |
See Select Data to Include in Reports for more information.
Last Updated: March 11, 2024